Connectez-vous/S’inscrire
Votre e-mail a été envoyé.

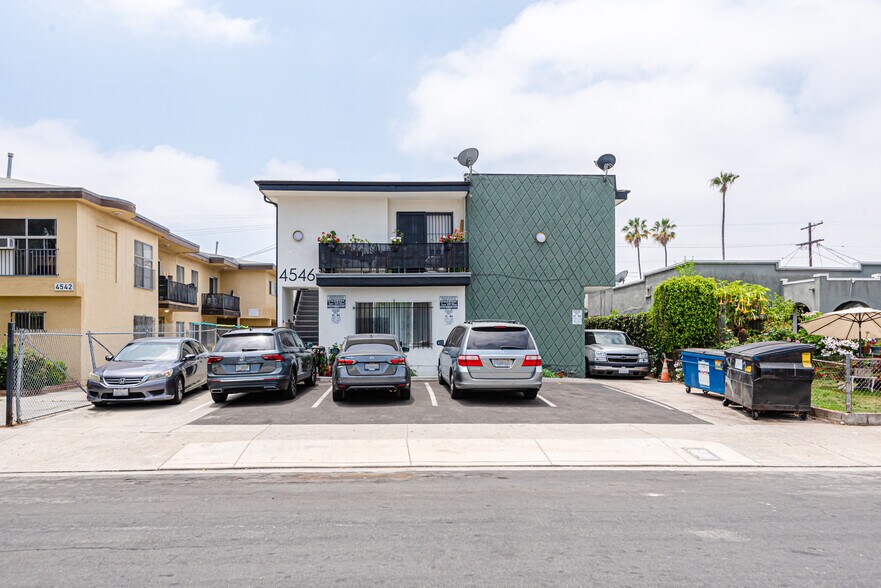
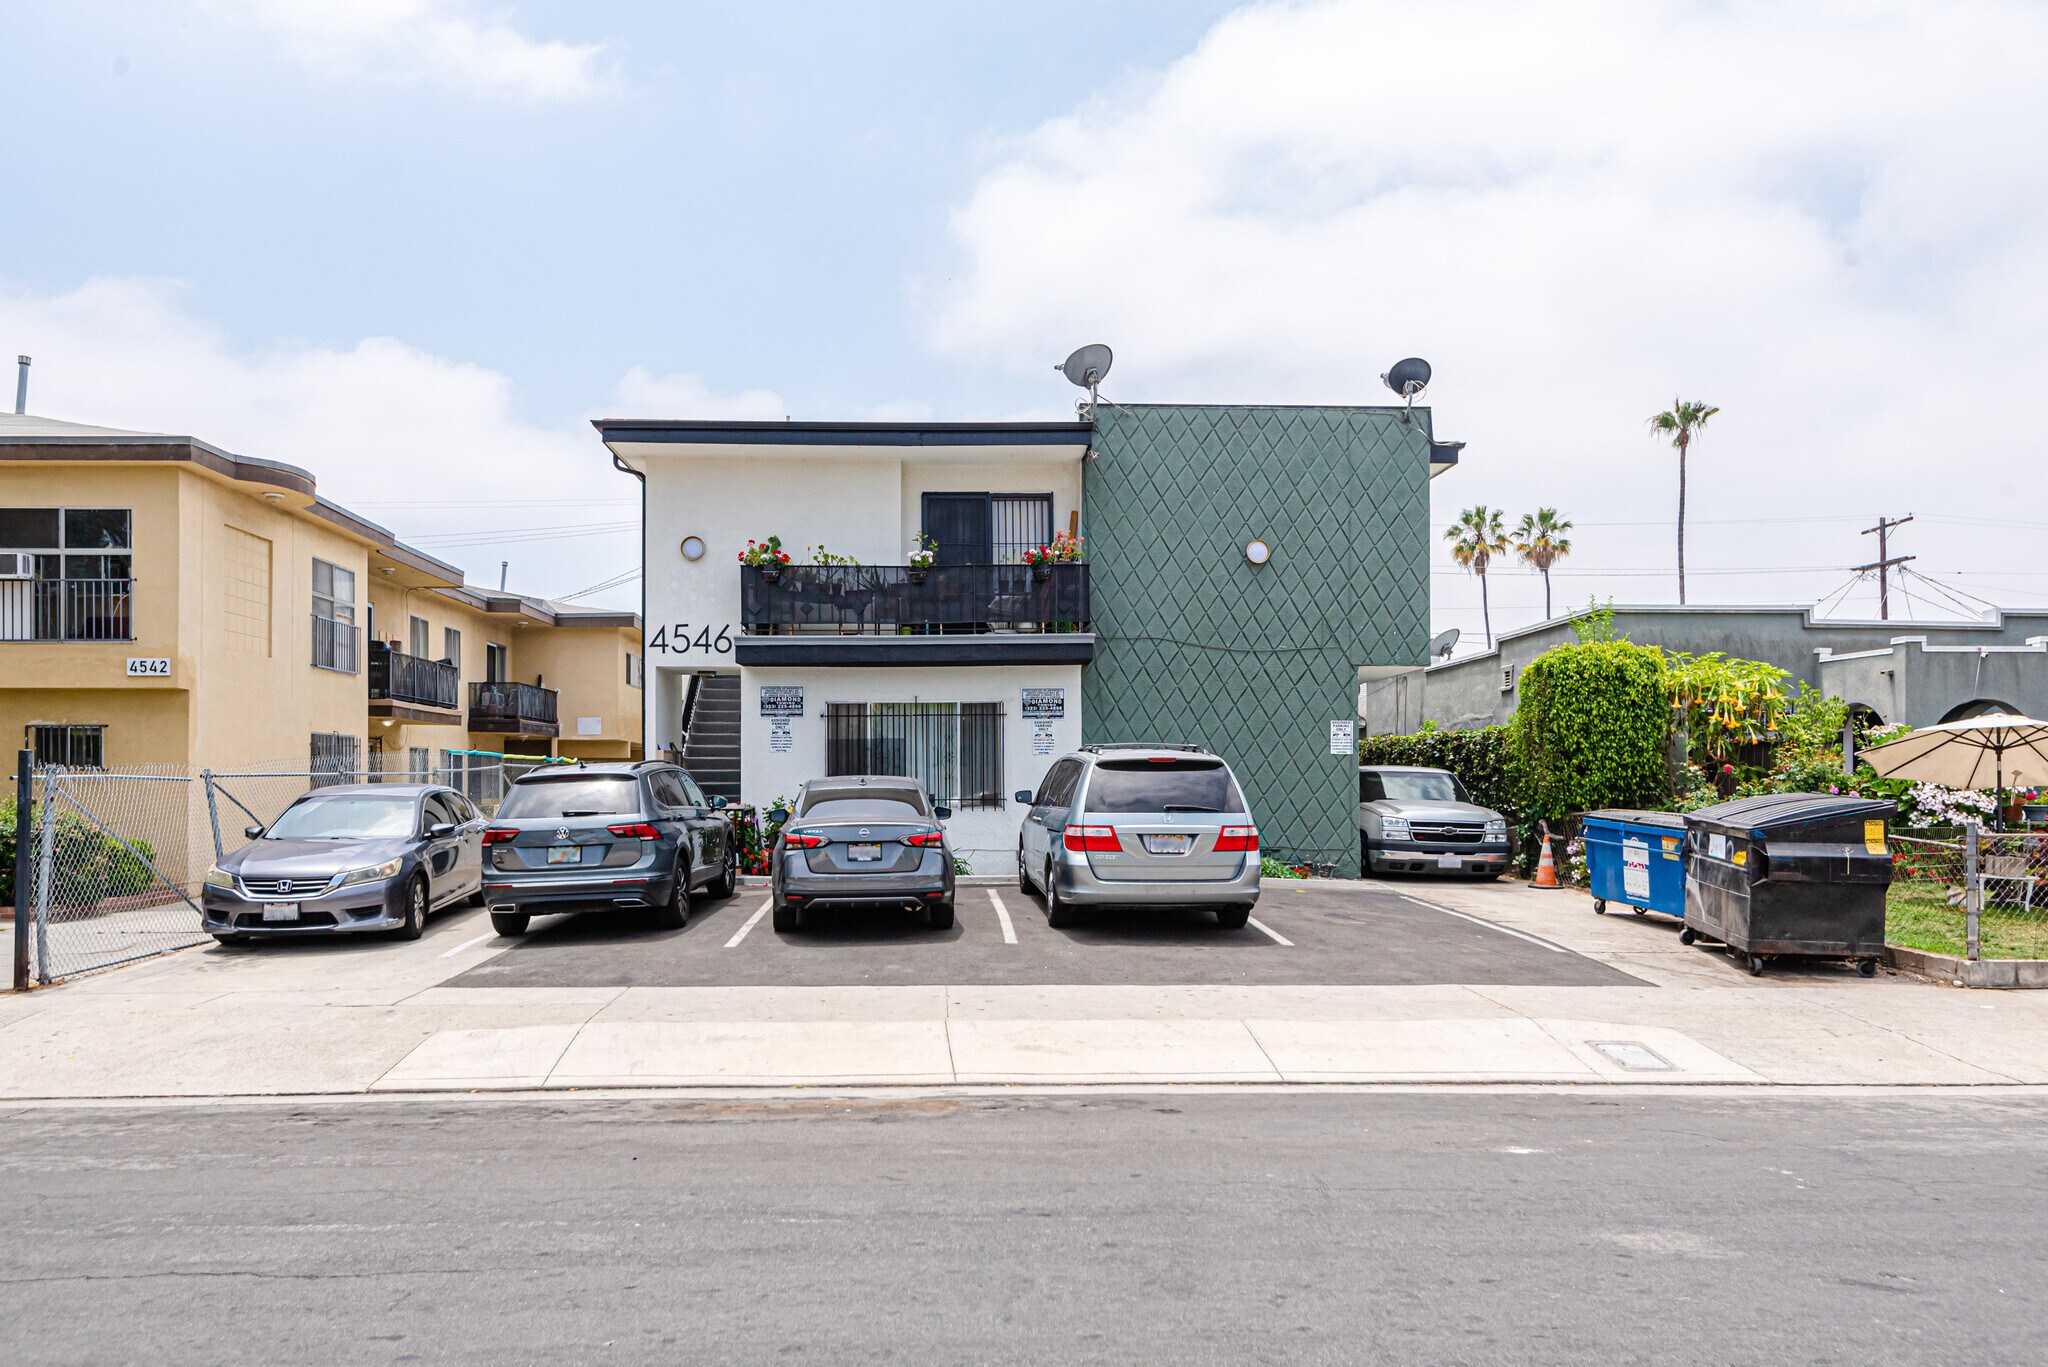
4546 W 17th St Immeuble residentiel 10 lots 1 893 675 € (189 368 €/Lot) Taux de capitalisation 6,09 % Los Angeles, CA 90019
Certaines informations ont été traduites automatiquement.
INFORMATIONS PRINCIPALES SUR L'INVESTISSEMENT
- ~29% Rent Upside
- Income-Generating ADUs
- Rent vs. Buy Affordability Gap Favors Investors
- Balanced Unit Mix with Built-In Flexibility
- Mid-City: A Core Los Angeles Submarket
- Strong Regional Economic Drivers
RÉSUMÉ ANALYTIQUE
~29% Rent Upside
This partially stabilized asset offers nearly 30% upside in rental income. With strategic updates and turnover management, new ownership can unlock significant near-term gains and elevate the property’s long-term performance.
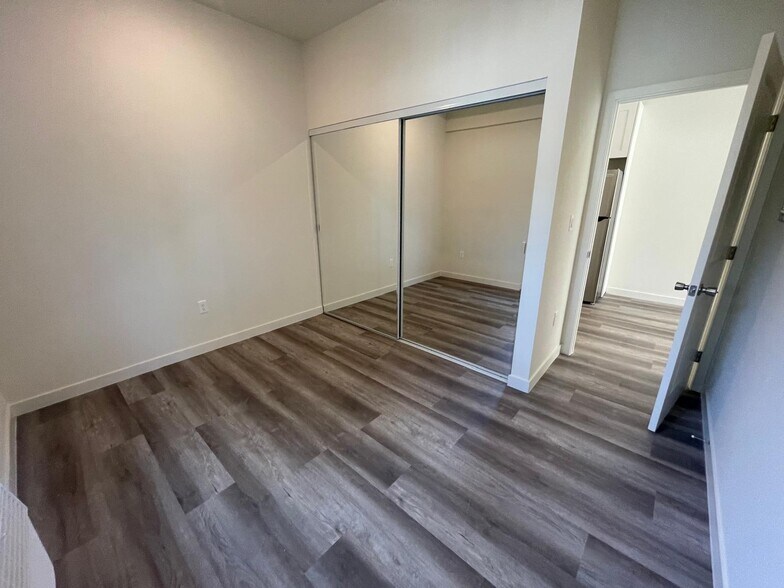
Balanced Unit Mix with Built-In Flexibility
The mix of (2) 2-Bed/2-Bath, (6) 1-Bed/1-Bath, and (2) 2-Bed/2-Bath ADUs provides an ideal balance of unit types. The larger units attract long-term renters, promoting income stability, while the 1-bed units offer higher turnover opportunities, allowing frequent rent adjustments aligned with market growth.
Income-Generating ADUs
Two legally permitted ADUs enhance this property’s revenue profile. With California’s pro-ADU legislation, these additions are both compliant and lucrative—delivering value in a market where maximizing land use is crucial.
Mid-City: A Core Los Angeles Submarket
Centrally located in the heart of Los Angeles, Mid-City sits between major employment hubs—Downtown LA, Culver City, Beverly Hills, and Hollywood. The neighborhood is densely populat-ed and renter-heavy, with about 63.4% of households renting. Its cultural diversity, access to major thoroughfares, and proximity to employment corridors make it a dependable rental market.
Rent vs. Buy Affordability Gap Favors Investors
In LA County, the median homebuyer needs to earn over $222K/year to afford a median-priced home, while the average renter pays ~$2,200/month—a massive affordability gap. This drives con-sistent demand for rentals, especially in neighborhoods like Mid-City where location meets relative affordability.
Strong Regional Economic Drivers
The property benefits from proximity to several regional job engines, including the Wilshire Mira-cle Mile museum district, Cedars-Sinai, USC, and the Expo & Crenshaw Metro lines. The nearby employment ecosystem includes entertainment, healthcare, higher education, and government sectors—offering tenants stable, diverse job access.
This partially stabilized asset offers nearly 30% upside in rental income. With strategic updates and turnover management, new ownership can unlock significant near-term gains and elevate the property’s long-term performance.
Balanced Unit Mix with Built-In Flexibility
The mix of (2) 2-Bed/2-Bath, (6) 1-Bed/1-Bath, and (2) 2-Bed/2-Bath ADUs provides an ideal balance of unit types. The larger units attract long-term renters, promoting income stability, while the 1-bed units offer higher turnover opportunities, allowing frequent rent adjustments aligned with market growth.
Income-Generating ADUs
Two legally permitted ADUs enhance this property’s revenue profile. With California’s pro-ADU legislation, these additions are both compliant and lucrative—delivering value in a market where maximizing land use is crucial.
Mid-City: A Core Los Angeles Submarket
Centrally located in the heart of Los Angeles, Mid-City sits between major employment hubs—Downtown LA, Culver City, Beverly Hills, and Hollywood. The neighborhood is densely populat-ed and renter-heavy, with about 63.4% of households renting. Its cultural diversity, access to major thoroughfares, and proximity to employment corridors make it a dependable rental market.
Rent vs. Buy Affordability Gap Favors Investors
In LA County, the median homebuyer needs to earn over $222K/year to afford a median-priced home, while the average renter pays ~$2,200/month—a massive affordability gap. This drives con-sistent demand for rentals, especially in neighborhoods like Mid-City where location meets relative affordability.
Strong Regional Economic Drivers
The property benefits from proximity to several regional job engines, including the Wilshire Mira-cle Mile museum district, Cedars-Sinai, USC, and the Expo & Crenshaw Metro lines. The nearby employment ecosystem includes entertainment, healthcare, higher education, and government sectors—offering tenants stable, diverse job access.
BILAN FINANCIER (RÉEL - 2024) Cliquez ici pour accéder à |
ANNUEL | ANNUEL PAR m² |
|---|---|---|
| Revenu de location brut |
$99,999

|
$9.99
|
| Autres revenus |
$99,999
|
$9.99
|
| Perte due à la vacance |
$99,999
|
$9.99
|
| Revenu brut effectif |
$99,999
|
$9.99
|
| Taxes |
$99,999
|
$9.99
|
| Frais d’exploitation |
$99,999
|
$9.99
|
| Total des frais |
$99,999
|
$9.99
|
| Résultat net d’exploitation |
$99,999
|
$9.99
|
BILAN FINANCIER (RÉEL - 2024) Cliquez ici pour accéder à
| Revenu de location brut | |
|---|---|
| Annuel | $99,999 |
| Annuel par m² | $9.99 |
| Autres revenus | |
|---|---|
| Annuel | $99,999 |
| Annuel par m² | $9.99 |
| Perte due à la vacance | |
|---|---|
| Annuel | $99,999 |
| Annuel par m² | $9.99 |
| Revenu brut effectif | |
|---|---|
| Annuel | $99,999 |
| Annuel par m² | $9.99 |
| Taxes | |
|---|---|
| Annuel | $99,999 |
| Annuel par m² | $9.99 |
| Frais d’exploitation | |
|---|---|
| Annuel | $99,999 |
| Annuel par m² | $9.99 |
| Total des frais | |
|---|---|
| Annuel | $99,999 |
| Annuel par m² | $9.99 |
| Résultat net d’exploitation | |
|---|---|
| Annuel | $99,999 |
| Annuel par m² | $9.99 |
INFORMATIONS SUR L’IMMEUBLE
| Prix | 1 893 675 € | Sous-type de bien | Appartement |
| Prix par lot | 189 368 € | Classe d’immeuble | C |
| Type de vente | Investissement | Surface du lot | 0,07 ha |
| Taux de capitalisation | 6,09 % | Surface de l’immeuble | 643 m² |
| Multiplicateur du loyer brut | 10.47 | Nb d’étages | 2 |
| Nb de lots | 10 | Année de construction | 1964 |
| Type de bien | Immeuble residentiel | ||
| Zonage | LARD1.5 - residential | ||
| Prix | 1 893 675 € |
| Prix par lot | 189 368 € |
| Type de vente | Investissement |
| Taux de capitalisation | 6,09 % |
| Multiplicateur du loyer brut | 10.47 |
| Nb de lots | 10 |
| Type de bien | Immeuble residentiel |
| Sous-type de bien | Appartement |
| Classe d’immeuble | C |
| Surface du lot | 0,07 ha |
| Surface de l’immeuble | 643 m² |
| Nb d’étages | 2 |
| Année de construction | 1964 |
| Zonage | LARD1.5 - residential |
CARACTÉRISTIQUES
CARACTÉRISTIQUES DU LOT
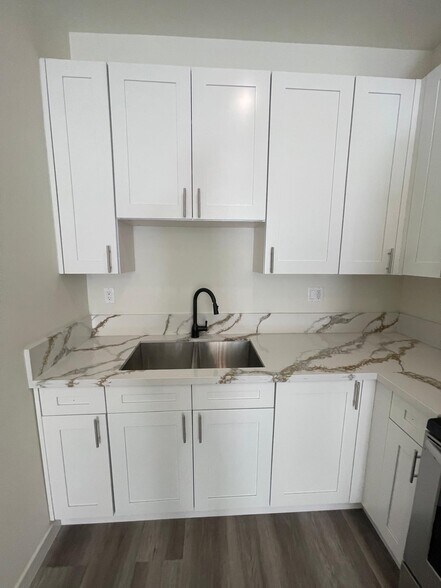
- Cuisine
CARACTÉRISTIQUES DU SITE
- Accès 24 h/24
LOT INFORMATIONS SUR LA COMBINAISON
| DESCRIPTION | NB DE LOTS | MOY. LOYER/MOIS | m² |
|---|---|---|---|
| 2+2 | 4 | 1 565 € | - |
| 1+1 | 6 | 1 239 € | - |
1 1
Walk Score®
Très praticable à pied (87)
TAXES FONCIÈRES
| Numéro de parcelle | 5071-013-041 | Évaluation totale | 1 799 312 € (2025) |
| Évaluation du terrain | 1 343 485 € (2025) | Impôts annuels | -1 € (0,00 €/m²) |
| Évaluation des aménagements | 455 828 € (2025) | Année d’imposition | 2024 |
TAXES FONCIÈRES
Numéro de parcelle
5071-013-041
Évaluation du terrain
1 343 485 € (2025)
Évaluation des aménagements
455 828 € (2025)
Évaluation totale
1 799 312 € (2025)
Impôts annuels
-1 € (0,00 €/m²)
Année d’imposition
2024

1 sur 33
VIDÉOS
VISITE EXTÉRIEURE 3D MATTERPORT
VISITE 3D
PHOTOS
STREET VIEW
RUE
CARTE
1 sur 1
Présenté par
4546 W 17th St
Vous êtes déjà membre ? Connectez-vous
Hum, une erreur s’est produite lors de l’envoi de votre message. Veuillez réessayer.
Merci ! Votre message a été envoyé.